Industrial Solar Cost India
Industrial Solar Cost India 2026: 100kW to 1MW
2026-06-26T00:00:00.000Z•8
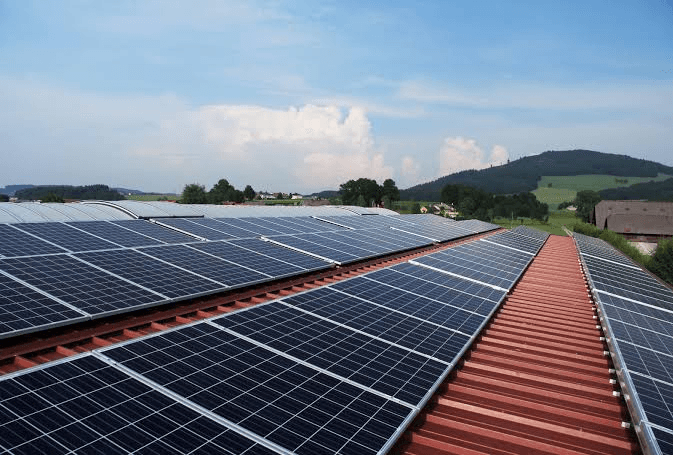
Industrial solar in India in 2026 costs ₹42,000 to ₹65,000 per kW depending on plant size, module brand, inverter type, rooftop vs ground-mount, and DISCOM zone.
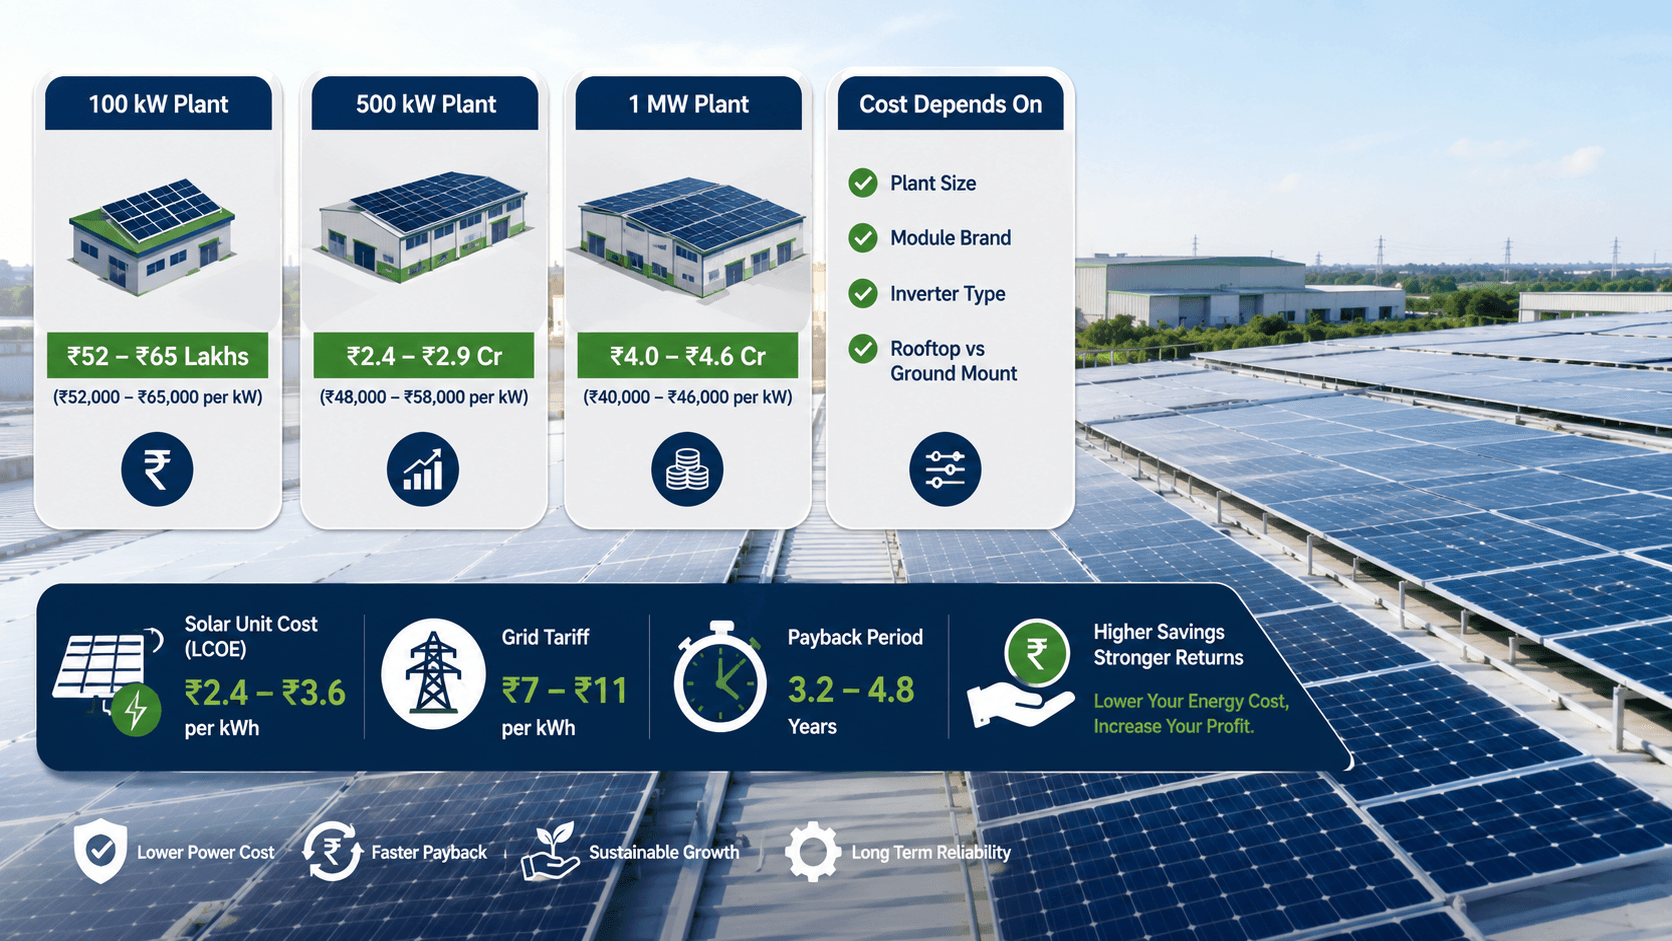
The generated unit cost (LCOE) lands between ₹2.4 and ₹3.6 per kWh against a grid tariff of ₹7 to ₹11, with payback between 3.2 and 4.8 years.
For broader pricing context, read our solar installation cost in India guide.
100 kW plant:
₹52 to ₹65 lakhs total CAPEX (₹52,000 to ₹65,000 per kW).
500 kW plant:
₹2.4 to ₹2.9 Cr total CAPEX (₹48,000 to ₹58,000 per kW).
1 MW plant:
₹4.0 to ₹4.6 Cr total CAPEX (₹40,000 to ₹46,000 per kW).
Solar unit cost (LCOE):
₹2.4 to ₹3.6 per kWh vs grid ₹7 to ₹11.
Payback period:
3.2 to 4.8 years with accelerated depreciation.
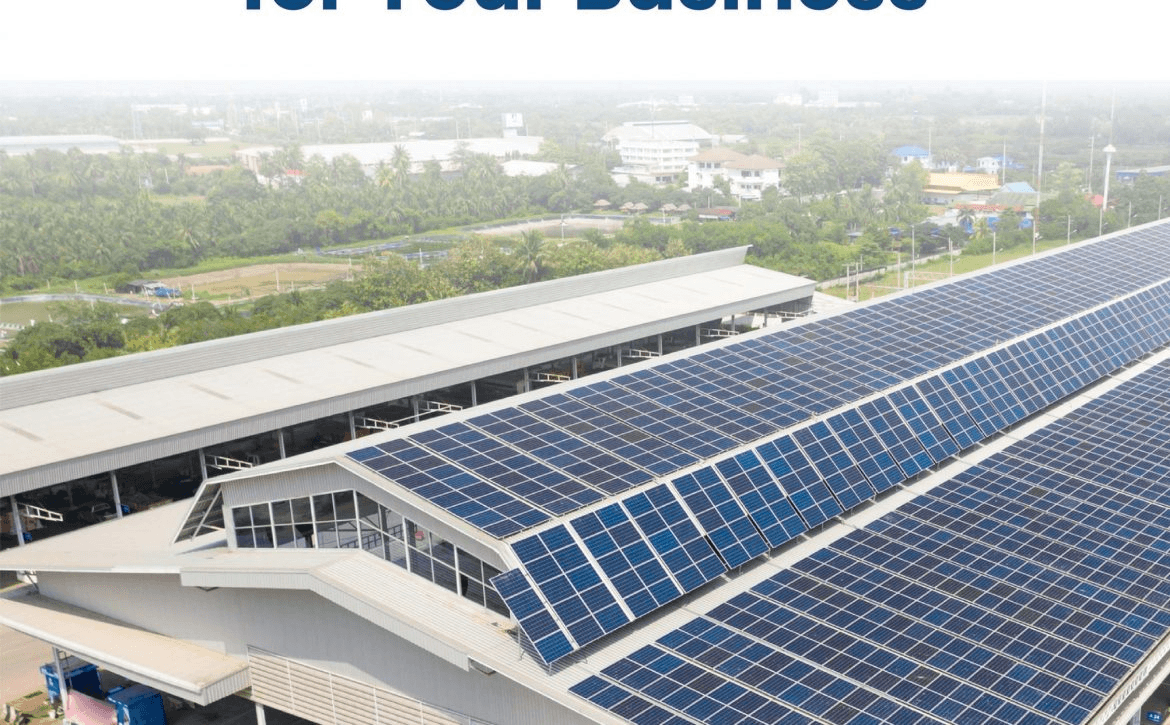
Industrial solar in 2026 sits in a tighter cost band than in 2024 because ALMM Phase II, BCD on cells, and TOPCon module pricing have stabilised. Per-kW pricing now depends more on plant size, scope, and brand than on import volatility.
100 kW to 250 kW:
₹52,000 to ₹65,000 per kW
250 kW to 500 kW:
₹48,000 to ₹58,000 per kW
500 kW to 1 MW:
₹42,000 to ₹50,000 per kW
Rooftop industrial:
Lower civil cost, higher BOS and structural cost.
Ground-mount industrial:
Higher civil cost, lower per-kW MMS cost.
Net difference: 6% to 12% in total CAPEX.
Compare with our ground-mounted solar plant cost in India guide.
ALMM Phase II expanded the eligible domestic supplier base.
BCD on solar cells stabilised at 20%, reducing month-to-month price swings.
TOPCon modules dropped to within 4% to 6% of Mono PERC pricing.
Per-kW cost drops as plant size grows because civil, BOS, and approval costs are partly fixed regardless of size.
Plant Size | Cost Per kW (2026) | Total CAPEX |
100 kW | ₹55,000 to ₹65,000 | ₹55 to ₹65 lakhs |
250 kW | ₹50,000 to ₹58,000 | ₹1.25 to ₹1.45 Cr |
500 kW | ₹48,000 to ₹54,000 | ₹2.40 to ₹2.70 Cr |
750 kW | ₹45,000 to ₹50,000 | ₹3.40 to ₹3.75 Cr |
1 MW | ₹42,000 to ₹46,000 | ₹4.20 to ₹4.60 Cr |
These bands assume Tier-1 modules, Tier-1 string inverters, GI-galvanised MMS, full civil, and DISCOM approvals.
For factory-specific cost depth, see our solar EPC cost guide for Gujarat factories.
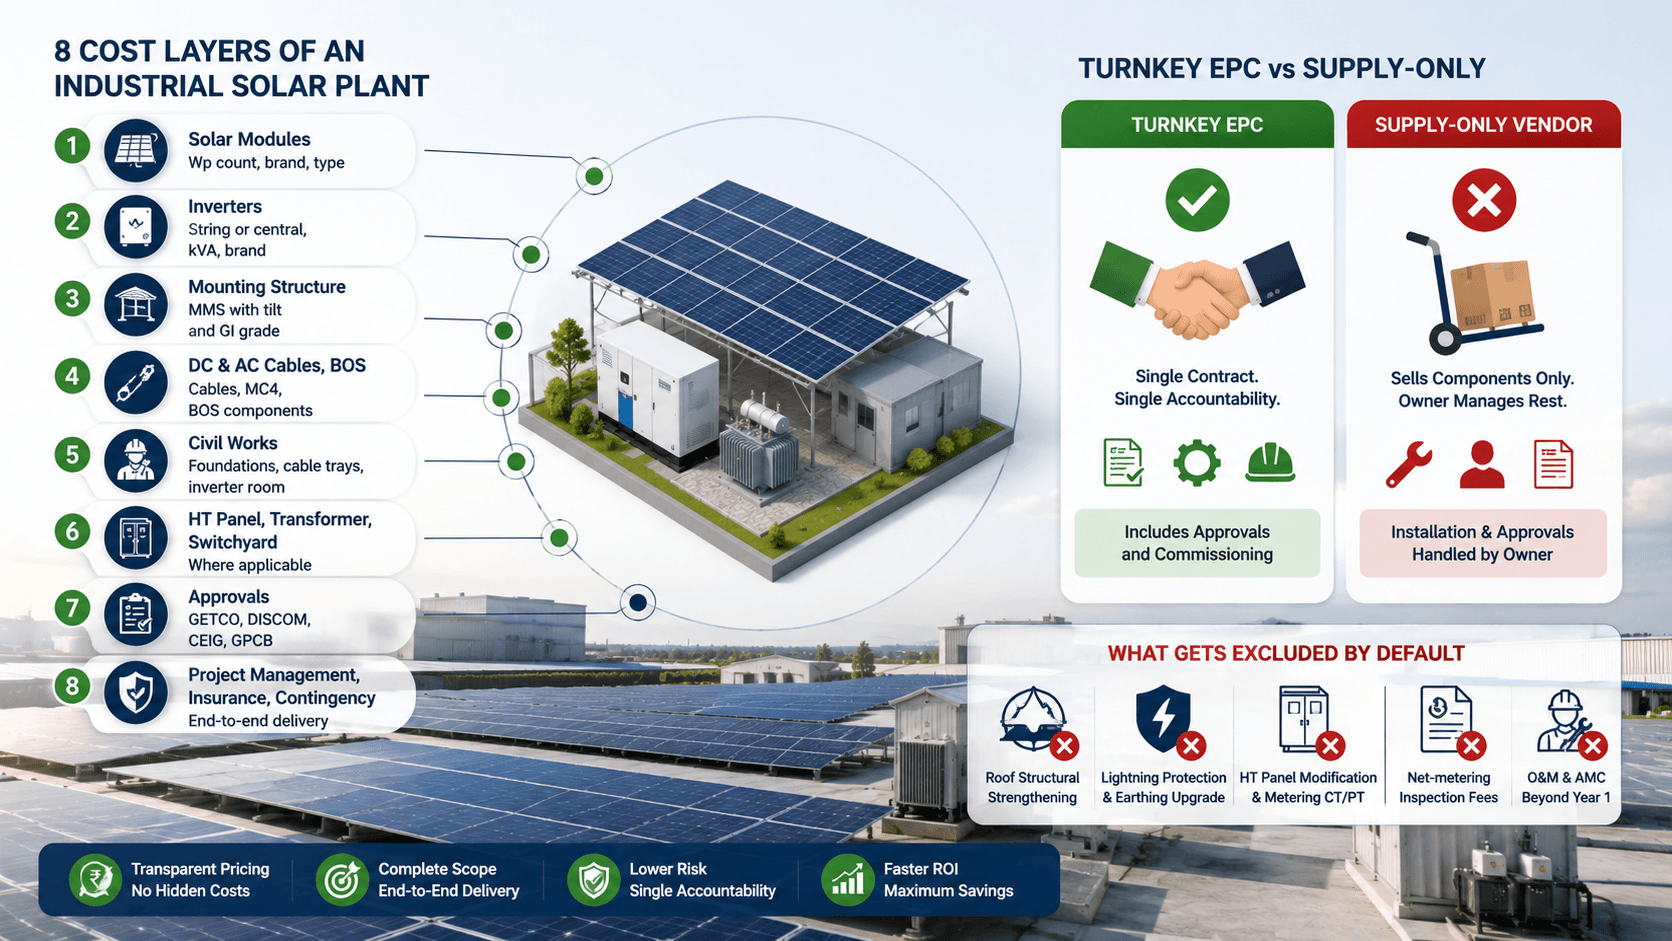
A real industrial solar quotation breaks cost into 8 layers. Anything missing pushes hidden cost onto the buyer.
Solar modules (Wp count, brand, type)
Inverters (string or central, kVA, brand)
Mounting structure (MMS) with tilt and GI grade
DC and AC cables, MC4, BOS
Civil works (foundations, cable trays, inverter room)
HT panel, transformer, switchyard (where applicable)
Approvals: GETCO, DISCOM, CEIG, GPCB
Project management, insurance, contingency
Turnkey EPC:
Single contract, single accountability, includes approvals and commissioning.
Supply-only vendor:
Only sells components. Owner handles installation and approvals.
Read EPC vs non-EPC solar contractors for the contractor decision framework.
Roof structural strengthening
Lightning protection and earthing grid upgrade
HT panel modification and metering CT/PT
Net-metering inspection fees
O&M and AMC beyond year 1
CFOs win negotiation rooms when they read solar quotes in percentage of CAPEX, not lump-sum prices.
Component | Share of CAPEX |
Solar modules | 38% to 42% |
Inverters and SCADA | 9% to 11% |
Mounting structure (MMS) | 7% to 10% |
DC and AC cables, BOS | 8% to 10% |
Civil and electrical works | 10% to 12% |
Transformer, HT panel | 6% to 9% (where applicable) |
Approvals (GETCO, DISCOM, CEIG, GPCB) | 3% to 5% |
Project management, contingency | 3% to 5% |
Use this table to normalise 3 vendor quotes side by side.
The honest measure of industrial solar is not CAPEX. It is the cost per generated unit (LCOE) across 25 years.
1 kW installed generates 1,400 to 1,600 kWh per year in most Indian states.
Over 25 years, that is roughly 35,000 to 38,000 kWh per kW.
₹50,000 per kW CAPEX / 36,000 kWh =
₹1.4 per kWh on raw CAPEX
.
Adding O&M, insurance, and degradation:
₹2.4 to ₹3.6 per kWh LCOE
.
Source | ₹/kWh (2026) |
Industrial solar (LCOE) | ₹2.4 to ₹3.6 |
HT industrial grid | ₹7 to ₹11 |
Diesel backup | ₹19 to ₹28 |
Solar runs at one-third the cost of grid power and one-eighth the cost of diesel.
A 1 kW industrial solar plant saves ₹1.6 to ₹2.4 lakhs in net electricity cost across 25 years.
For deeper savings math, read solar energy savings in India.
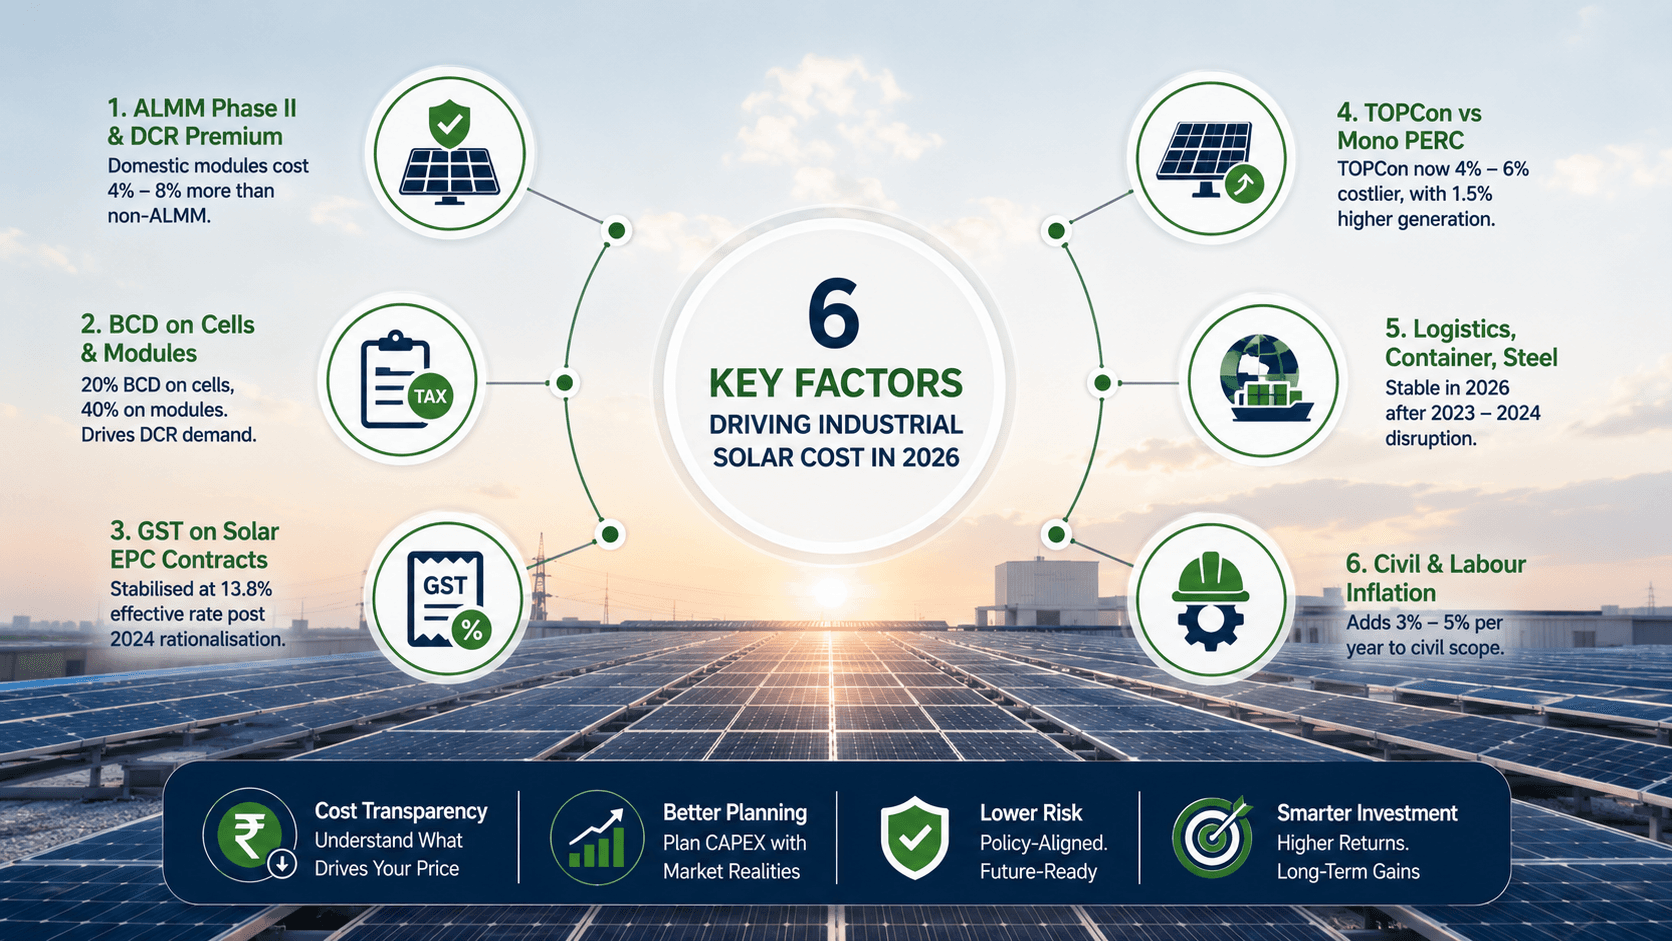
Six policy and market levers move the per-kW price in 2026.
ALMM Phase II and DCR premium:
Domestic modules cost 4% to 8% more than non-ALMM.
BCD on solar cells and modules:
20% BCD on cells, 40% on modules. Drives DCR demand.
GST on solar EPC contracts:
Stabilised at 13.8% effective rate post 2024 rationalisation.
TOPCon vs Mono PERC:
TOPCon now 4% to 6% costlier, with 1.5% higher generation.
Logistics, container, steel:
Stable in 2026 after 2023 to 2024 disruption.
Civil and labour inflation:
Adds 3% to 5% per year to civil scope.
Industrial solar in 2026 pays back in 3.2 to 4.8 years, with accelerated depreciation cutting payback by 18% to 24%.
Plant Size | Payback (no AD) | Payback (with AD) |
100 kW | 4.4 to 4.8 years | 3.5 to 3.9 years |
500 kW | 3.8 to 4.2 years | 3.1 to 3.4 years |
1 MW | 3.5 to 3.9 years | 2.9 to 3.2 years |
40% AD in year 1 plus 40% normal depreciation in year 1 (cumulative).
Tax saving in year 1: 30% of total CAPEX for a 25% tax bracket entity.
Read our
accelerated depreciation tax benefits guide
.
Net-metering on rooftop adds ₹0.8 to ₹1.4 per kWh to effective savings.
Solar offsets variable charge but not demand charge.
Read net-metering solar income in Gujarat for state-specific math, and the broader solar payback period India 2026 framework.
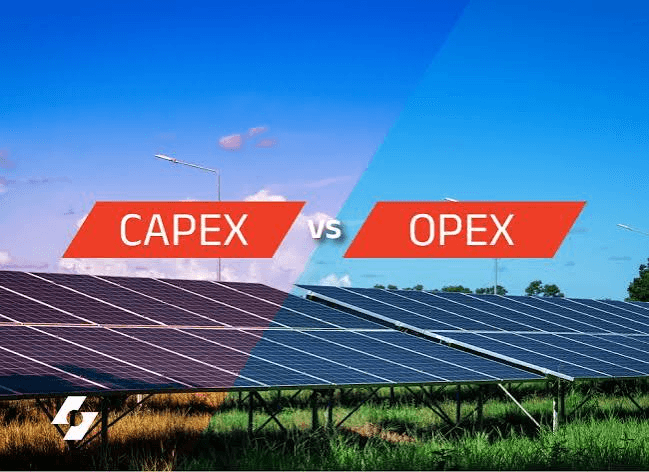
The right financing model depends on whether the buyer wants ownership, tax benefits, or zero upfront cost.
CAPEX:
Owner buys the plant. Gets AD, GST input credit, 25-year savings.
RESCO:
Developer builds, owns, and operates. Buyer pays ₹3.8 to ₹4.5 per kWh.
OPEX:
Lease model with end-of-term purchase option.
High-tax-bracket entities with strong balance sheet:
CAPEX wins on IRR.
Asset-light businesses, retail, services:
RESCO removes CAPEX hurdle.
MSMEs in transition:
OPEX is a useful middle path.
Decide using CAPEX vs RESCO solar financing.
These 6 costs rarely appear in the headline quote but always appear in the final bill.
Roof structural strengthening:
₹250 to ₹600 per sq.m for old roofs.
Lightning protection and earthing grid:
₹40,000 to ₹1.2 lakhs per plant.
HT panel modification and CT/PT:
₹1.5 to ₹4 lakhs.
GETCO bay charges and DISCOM fees:
₹2 to ₹8 lakhs depending on capacity.
Insurance (transit and erection):
0.4% to 0.7% of CAPEX.
O&M and AMC year 2 onward:
₹1.0 to ₹2.2 lakhs per MW per year.
Read our O&M contract inclusions guide before signing.
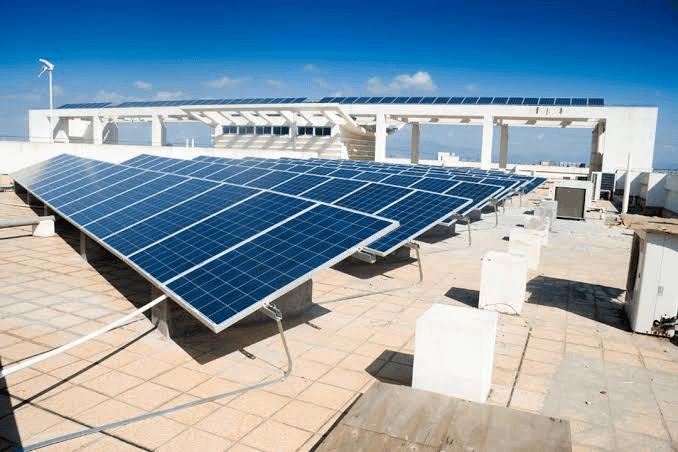
Bigger plants spread fixed costs across more kW, dropping the per-kW number by 25% to 35%.
Bulk procurement:
OEM-direct module and inverter pricing.
Inverter scale:
One 100 kVA central inverter vs ten 10 kW string inverters.
Civil:
Single inverter room, fewer cable trays per kW.
Approvals:
GETCO and CEIG cost is partly fixed.
Roof or land cannot accommodate larger plant.
Connected load and DISCOM sanctioned load do not match.
Self-consumption is below 60% (excess export hits net-metering caps).
For roof vs land choice, see rooftop vs ground-mounted solar for industrial sites.
Industrial solar beats grid power on every dimension that matters to a CFO.
Cost Head | Grid (₹/kWh) | Solar (₹/kWh) |
HT industrial tariff | ₹7 to ₹11 | NA |
Demand charge | ₹250 to ₹450 per kVA per month | Partial offset |
Diesel backup | ₹19 to ₹28 | Direct replacement |
Net 25-year cost | ₹65 to ₹90 lakhs per 100 kW | ₹14 to ₹22 lakhs per 100 kW |
Net 25-year savings on a 100 kW industrial plant: ₹45 to ₹70 lakhs after CAPEX, AD, and O&M.
See textile-specific examples in our solar for textile units in Surat and solar for factories cut power costs 40% guides.
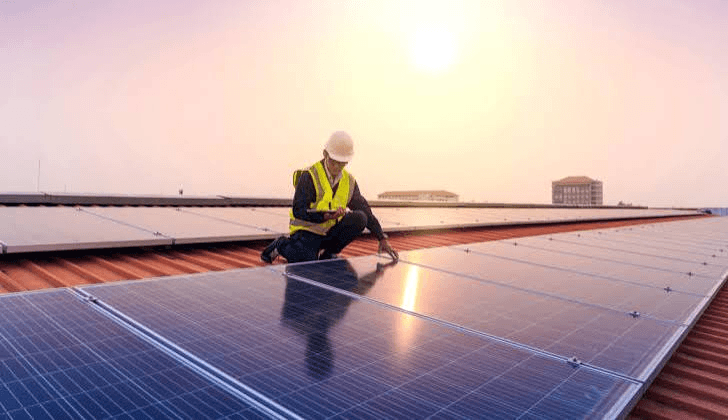
Real Earthwave projects show how cost translates into delivered plants across rooftop and ground-mount.
170 kW Pari Textile, Diamond Nagar:
Rooftop industrial, full BOS and net-metering.
120 kW Sahaj Textile, Sachin:
Rooftop with HT modification and CEIG.
80 kW Shivdhara Skylight:
Smaller industrial rooftop with structural strengthening.
2 MW True Colors, Palsana:
Industrial rooftop with central inverter and SCADA.
2 MW Goldi Solar, Amod:
Ground-mount with switchyard and DISCOM evacuation.
Browse the full Earthwave project portfolio.
Itemised BOM with module Wp, inverter kVA, MMS GI grade, cable size.
Cost-per-kW line and cost-per-unit line in every proposal.
AD impact and IRR statement attached for the CFO.
The fastest way to compare 3 quotes is to normalise them on 6 axes.
Per-kW pricing:
Strip every quote down to ₹/kW.
Module match:
Same Wp, brand, type (TOPCon vs Mono PERC).
Inverter match:
Same brand, kVA, warranty.
MMS match:
GI grade, tilt angle, wind load rating.
Scope match:
Civil, HT, approvals, O&M, insurance.
Generation guarantee:
PR clause, penalty cap, audit rights.
Use this with our solar EPC company checklist for India.
A cheap quote usually pushes risk back onto the buyer's balance sheet.
Generic terms like "branded module" or "leading inverter."
Civil and HT scope missing.
No PR or generation guarantee in writing.
One-page quote with no BOM.
No accelerated depreciation impact statement.
No mention of CEIG, DISCOM, or GPCB.
Two or more of these red flags should disqualify the vendor. Read solar EPC red flags in Gujarat.
Earthwave Solar is a vertically integrated EPC built to give CFOs CAPEX clarity, not marketing-grade ranges.
In-house Wave inverter manufacturing since 2024
: removes inverter price volatility. See the
Wave on-grid inverter guide for India
.
In-house solar module manufacturing from 2025
: lower BOM cost, single warranty.
Itemised BOM, no lump-sum quotes
: every line shows brand, Wp, kVA, GI grade.
Penalty-backed COD and PR generation guarantee
: LD tied to delivery and PR shortfall.
Bankable DPR for AD and lender approval
: ready for CFO and bank diligence.
Strong client portfolio:
Goldi Solar, Mahindra Susten, Torrent Power, GUVNL, Solnce, True Colors, Rajesh Power Services.
For the inverter selection lens, read solar inverter guide India.
Earthwave Solar is a Surat-based vertically integrated EPC with operations in Bhopal and project delivery across India.
Established in 2018, the company scaled from a 100 kW first installation to an 80 MW utility-scale ground-mount for Mahindra Susten, then added Wave inverter manufacturing in 2024 and solar module manufacturing in 2025.
True end-to-end EPC: engineering, procurement, civil, approvals, warranty, O&M.
In-house Wave inverter and module manufacturing for supply chain certainty.
Transparent CAPEX with itemised BOM and ₹/kWh LCOE in every quote.
AD, GST input credit, and IRR clearly stated for CFO clearance.
Strong
across rooftop, ground-mount, and hybrid.
Meet the Earthwave leadership team and explore the full industrial service stack.
A 100 kW industrial solar plant costs ₹55 to ₹65 lakhs total CAPEX in 2026, or ₹55,000 to ₹65,000 per kW. Pricing includes Tier-1 modules, Tier-1 inverter, MMS, BOS, civil, and DISCOM approvals.
A 1 MW industrial solar plant costs ₹4.2 to ₹4.6 Cr total CAPEX in 2026, or ₹42,000 to ₹46,000 per kW. Per-kW pricing is lower than 100 kW because civil, approvals, and BOS spread across more capacity.
Industrial solar in India runs at an LCOE of ₹2.4 to ₹3.6 per kWh across a 25-year asset life. This compares against HT industrial grid tariff of ₹7 to ₹11 per kWh and diesel backup of ₹19 to ₹28 per kWh.
Industrial solar in 2026 pays back in 3.2 to 4.8 years with accelerated depreciation, and 3.5 to 4.8 years without. Larger plants (500 kW to 1 MW) pay back faster due to lower per-kW cost.
Yes. Solar plants installed by Indian businesses qualify for 40% accelerated depreciation in year 1 plus normal depreciation, giving a strong year-1 tax shield. This cuts effective payback by 18% to 24% for taxed entities.
FAQS
Can't find the answer you're looking for? Our team is here to help.
SUBSCRIBE NEWSLETTER
Switching to solar is easier than you think. Let us guide you to cleaner, more affordable energy.
