Solar Sustainability
Solar Panel Carbon Footprint: How Much Does It Offset?
2026-06-04T00:00:00.000Z•8
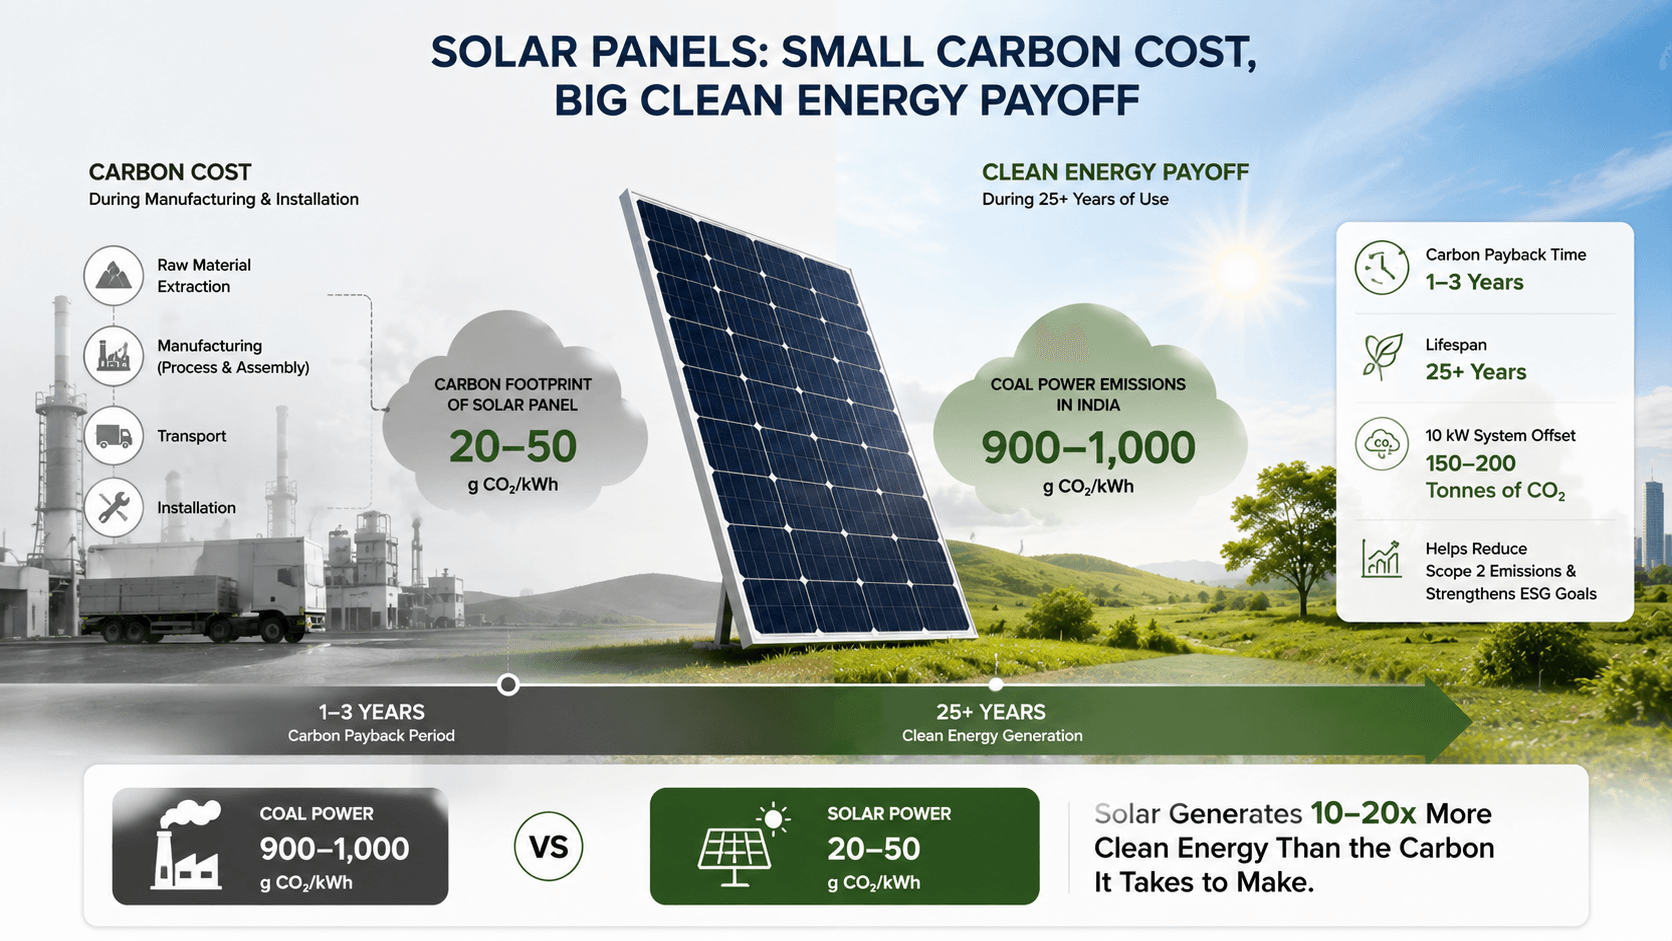
A typical solar panel produces around 20 to 50 grams of CO2 per kilowatt-hour (kWh) over its entire lifecycle.
That includes mining, manufacturing, transport, and installation. Compare that to coal, which emits 900 to 1,000 grams of CO2 per kWh in India.
Over a 25-year lifespan, a single solar panel offsets 10 to 20 times more carbon than it took to make it.
So yes, solar panels do have a carbon footprint.
But they pay it back within 1 to 3 years and then generate clean electricity for decades after that.
The carbon footprint of a solar panel comes mostly from manufacturing (silicon purification, cell production, and frame assembly).
Lifecycle emissions range from 20 to 50 g CO2/kWh, compared to 900+ g CO2/kWh for coal power in India.
A typical rooftop solar system pays back its carbon debt in 1 to 3 years.
Over 25 years, a 10 kW system can offset roughly 150 to 200 tonnes of CO2.
For businesses, solar is one of the fastest ways to reduce Scope 2 emissions and strengthen ESG reports.
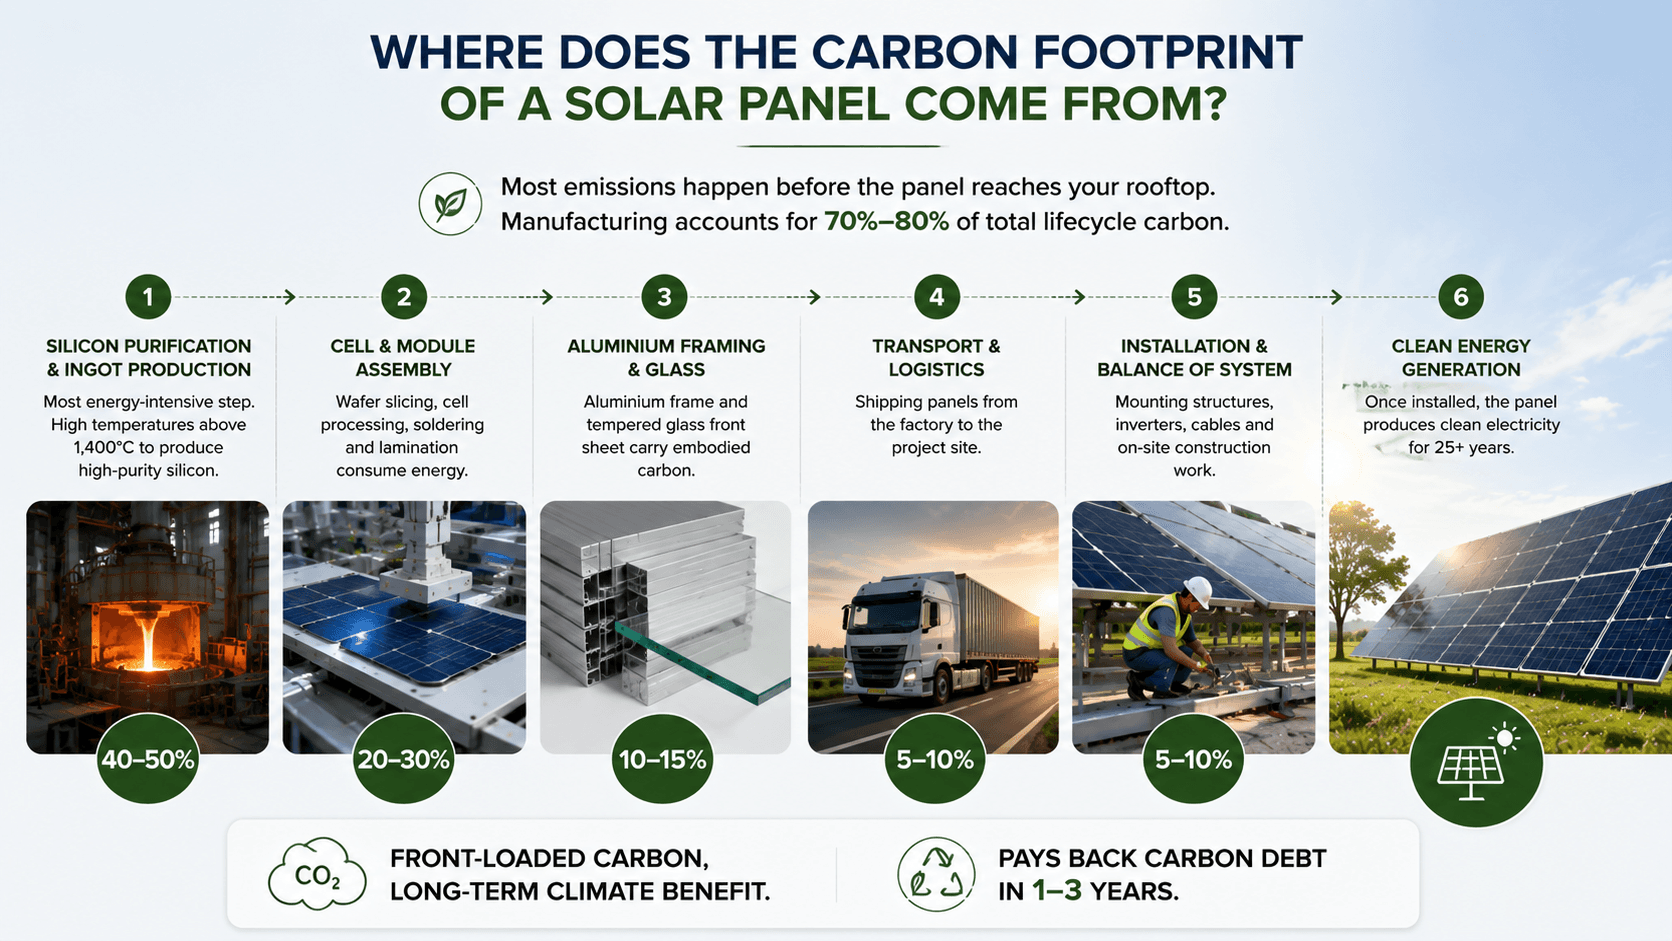
Most of the emissions happen before the panel reaches your rooftop. Manufacturing accounts for 70% to 80% of a solar panel's total lifecycle carbon footprint.
Silicon purification and ingot production
: This is the most energy-intensive step. Raw quartz gets processed into high-purity silicon at temperatures above 1,400°C. If the factory uses coal-fired electricity, emissions are higher.
Cell and module assembly
: Wafer slicing, cell processing, soldering, and lamination all consume energy.
Aluminium framing and glass
: The frame and tempered glass front sheet carry their own embodied carbon.
Transport and logistics
: Shipping panels from the manufacturing unit to the project site adds a smaller but real portion.
Installation and balance of system
, inverters, cables, and on-site construction work contribute a minor share.
Here is a rough breakdown of lifecycle emissions by stage:
Stage | Share of Total CO2 |
Silicon and cell manufacturing | 60% to 70% |
Module assembly | 10% to 15% |
Frame, glass, and encapsulants | 8% to 12% |
Transport | 3% to 5% |
Installation and BOS | 2% to 5% |
A single 540 W solar panel offsets roughly 14 to 20 tonnes of CO2 over its 25-year lifetime. A 10 kW rooftop solar system for homes offsets an estimated 150 to 200 tonnes of CO2 over the same period.
Single panel generation and offset (540 W, Gujarat-level sunlight):
Metric | Value |
Annual generation | 800 to 900 kWh |
25-year generation | 20,000 to 22,500 kWh |
Grid emission factor (India) | 0.7 to 0.9 kg CO2/kWh |
Lifetime CO2 offset (1 panel) | 14 to 20 tonnes |
System-level offset (10 kW rooftop system, approx. 18 to 19 panels):
Metric | Value |
System size | 10 kW |
Number of panels | 18 to 19 |
25-year CO2 offset | 150 to 200 tonnes |
Why this matters for your household:
Comparison | CO2 (per year) |
Average Indian household electricity footprint | 1.5 to 2 tonnes |
Offset from a well-sized rooftop system | Several times this amount |
Pro tip: If you are a business owner preparing ESG or sustainability reports, the CO2 offset numbers from your solar installation can directly reduce your reported Scope 2 emissions. See our guide on solar energy savings in India and keep your solar monitoring data organized from day one.
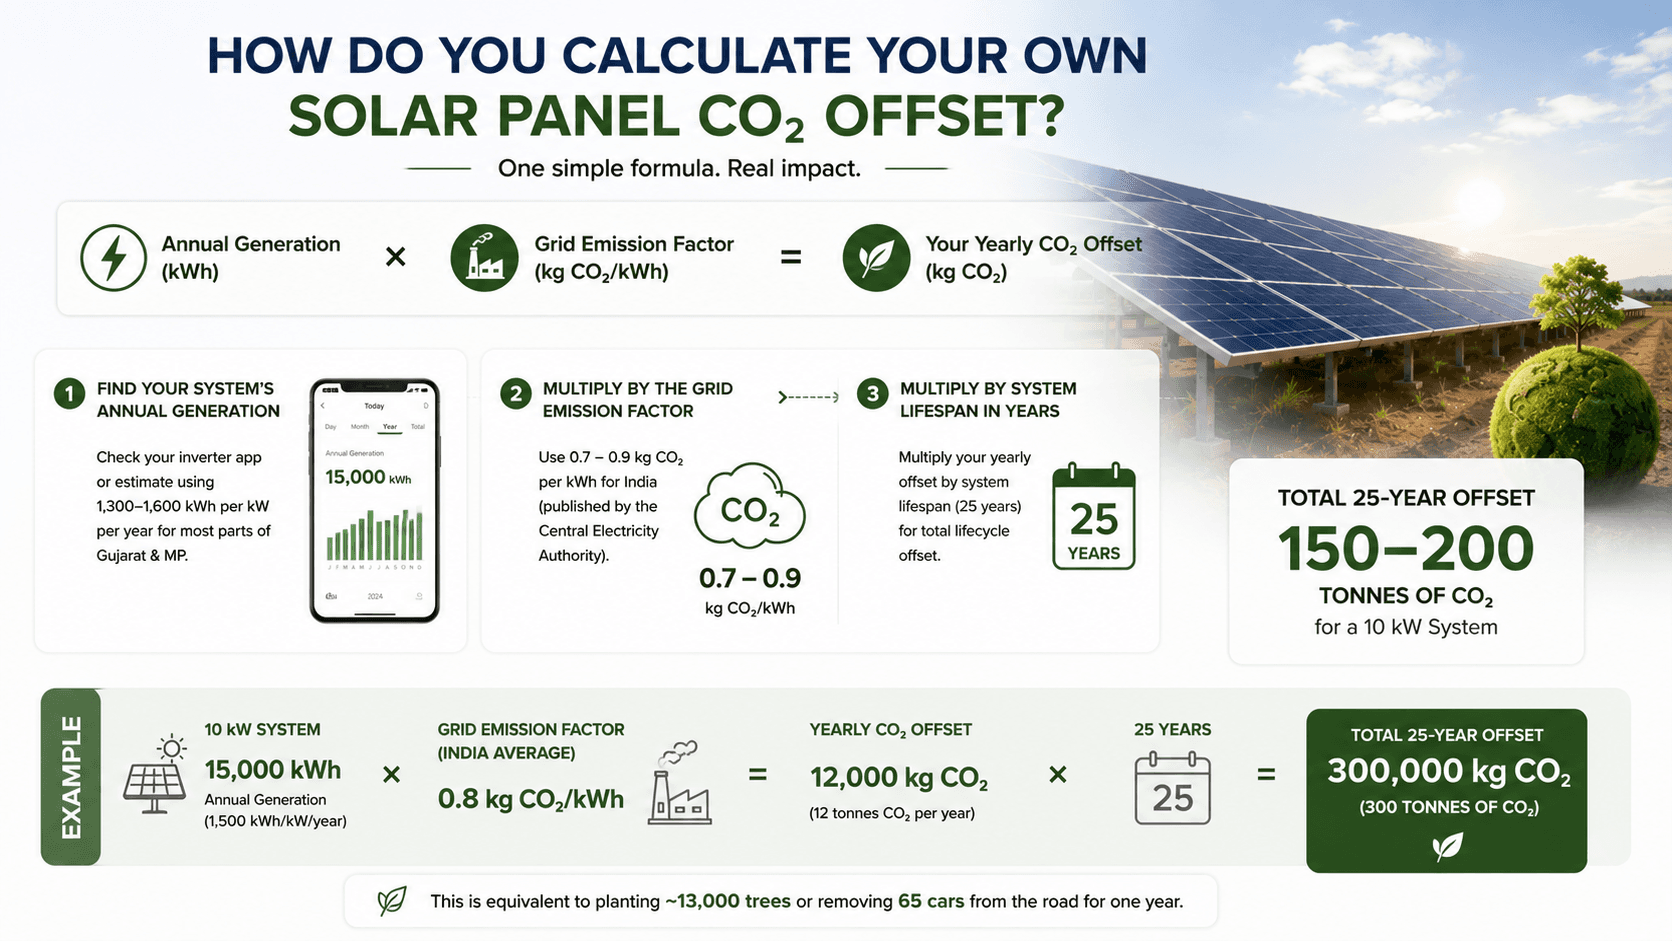
You can calculate your own CO2 offset with one simple formula: annual generation (kWh) x grid emission factor (kg CO2/kWh) = your yearly offset.
Find your system's annual generation.
Check your inverter app, or estimate using 1,300 to 1,600 kWh per kW per year for most parts of Gujarat and Madhya Pradesh.
Multiply by the grid emission factor.
Use 0.7 to 0.9 kg CO2 per kWh for India (published by the Central Electricity Authority).
Multiply by your system's lifespan in years
(25 years) for a full lifecycle offset figure.
A quick reference table for common system sizes:
System Size | Annual Generation (approx.) | Annual CO2 Offset (approx.) | 25-Year CO2 Offset (approx.) |
3 kW (home) | 4,000 to 4,800 kWh | 2.8 to 4.3 tonnes | 70 to 105 tonnes |
5 kW (home) | 6,500 to 8,000 kWh | 4.5 to 7.2 tonnes | 115 to 175 tonnes |
10 kW (home/small business) | 13,000 to 16,000 kWh | 9 to 14.4 tonnes | 230 to 350 tonnes |
100 kW (commercial/industrial) | 1,30,000 to 1,60,000 kWh | 91 to 144 tonnes | 2,275 to 3,500 tonnes |
These are estimates. Your exact number depends on roof orientation, shading, solar panel price in India, panel efficiency, and local irradiance.
For accurate generation data, pair your system with Wave on-grid inverters that offer real-time monitoring.
Most solar panels recover the energy used to manufacture them within 1 to 3 years. After that, every unit of electricity they produce is a net positive for the environment.
The energy payback period depends on a few factors:
Solar irradiance at your location
: High-irradiance regions like Gujarat, Rajasthan, and Madhya Pradesh have shorter payback periods because panels produce more energy per year.
Panel technology
: Monocrystalline panels have slightly higher manufacturing energy but also higher efficiency, so the payback period stays short.
Grid carbon intensity
: In India, where coal still dominates the grid mix, the carbon payback is even faster because each kWh of solar displaces a high-emission kWh from the grid.
Weather conditions
: Even on overcast days, panels keep generating. Check our guide on whether
solar panels work on cloudy days
for a full breakdown.
A rooftop solar system installed in Surat or Ahmedabad,
for instance, receives around 5 to 5.5 peak sun hours daily. This means panels here pay back their carbon debt faster than identical panels installed in northern Europe or cloudy coastal regions.
After the payback period, your solar panels generate clean energy for another 22 to 24 years. Read our detailed breakdown of the solar payback period in India for a full cost and time comparison.

Solar energy produces 15 to 20 times less CO2 per kWh than coal-fired power.
This gap is especially important in the Indian context, where coal still generates over 70% of the country's electricity.
Energy Source | Lifecycle CO2 Emissions (g/kWh) |
Coal (India average) | 900 to 1,050 |
Natural gas | 400 to 500 |
Solar PV (crystalline) | 20 to 50 |
Wind | 10 to 20 |
Switching to solar also has a direct financial upside alongside the environmental one.
See how much you could save with our guide on how to reduce your electricity bill with solar in Gujarat.
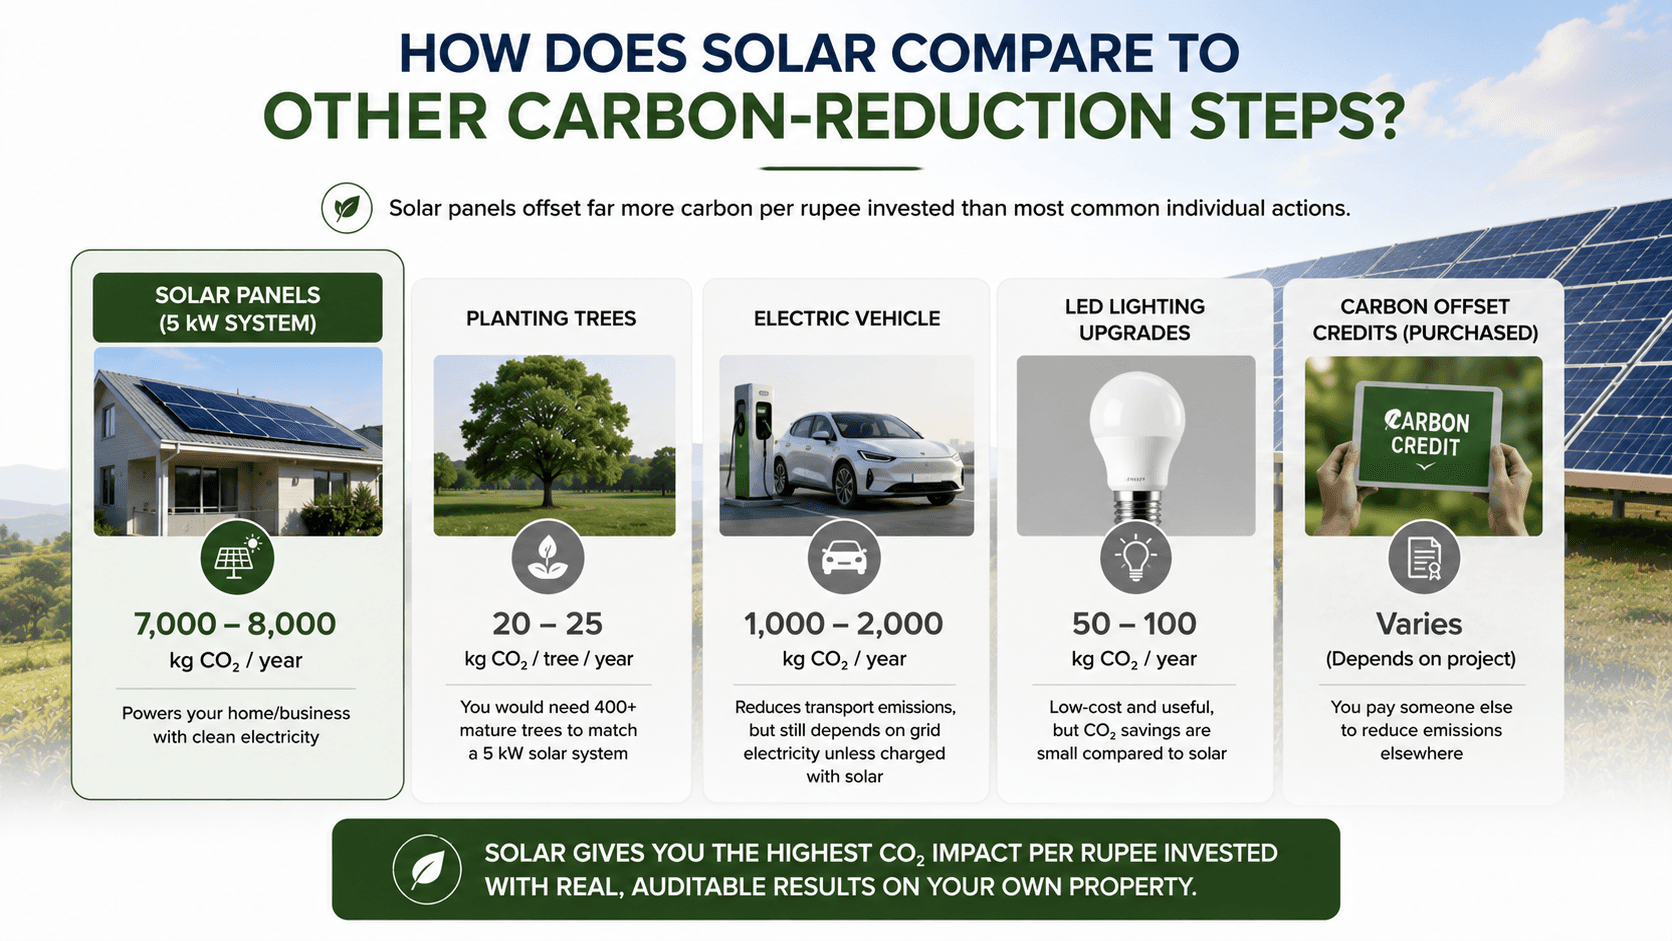
Solar panels offset far more carbon per rupee invested than most common individual climate actions.
This matters if you are weighing solar against other "green" choices for your home or business.
Here is a practical comparison:
Planting trees
: A mature tree absorbs roughly 20 to 25 kg of CO2 per year. You would need over 400 trees, plus decades of growth time, to match the annual offset of a single 5 kW rooftop solar system.
Switching to an electric vehicle
: EVs reduce transport emissions, but they still draw power from the same coal-heavy grid unless you charge them with solar. Pairing an EV with rooftop solar multiplies the benefit.
LED lighting upgrades
: Useful and low-cost, but the CO2 savings are small compared to displacing your home or factory's entire grid electricity demand with solar.
Carbon offset credits (purchased)
: These let you pay someone else to reduce emissions elsewhere. Solar lets you reduce your own emissions directly, with a visible, auditable result on your own property.
For a balanced view, see our breakdown of the advantages and limitations of solar energy.
Yes. Where a panel is manufactured directly affects its embodied carbon, because grid electricity powers the manufacturing process.
Lifecycle emissions by manufacturing region:
Manufacturing Region | Grid Type | Lifecycle Emissions (g CO2/kWh) |
China | Coal-heavy grid | 40 to 50 |
Norway, France | Clean grid (hydro/nuclear) | 15 to 25 |
India (growing domestic capacity) | Mixed, improving | Decreasing over time |
Key points:
China produces the majority of the world's solar panels, and a large share of that manufacturing still runs on coal power.
A cleaner manufacturing grid means lower embodied carbon, even for the same panel design.
India's domestic manufacturing capacity is expanding. As India's own grid gets cleaner, panels made in India will carry a lower footprint too.
Your EPC partner's sourcing choices affect your system's true environmental footprint, not just its price or performance.
Pro tip: Ask your EPC provider where their panels are manufactured. It's a fair question, and a transparent answer is a good sign of a reliable partner. Use our solar EPC company checklist for India and our list of solar EPC red flags in Gujarat before you sign a contract.
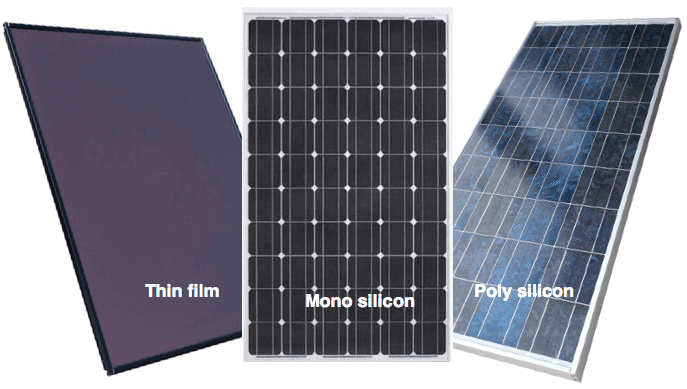
Monocrystalline panels generally carry a slightly higher manufacturing footprint than polycrystalline panels, but they offset more carbon over their lifetime due to higher efficiency.
Thin-film panels have the lowest manufacturing footprint but the lowest efficiency too.
Here is a side-by-side view:
Panel Type | Manufacturing Footprint | Efficiency | Best For |
Monocrystalline | Slightly higher (more processing) | 20% to 23% | Limited roof space, rooftop residential, commercial |
Polycrystalline | Moderate | 15% to 17% | Larger roofs, budget-conscious projects |
Thin-film | Lowest | 10% to 13% | Ground mount, large open land, low-weight needs |
What this means in practice:
Smaller roof, higher output needed
: Monocrystalline is usually the right call, since it produces more power per square foot despite a slightly higher manufacturing footprint.
See our picks for
best solar panels for home in India
.
Large factory roof or open land
: Polycrystalline or thin-film can offset more total carbon per rupee spent due to lower manufacturing emissions per panel.
Net result
: Once installed, all three types generate clean electricity with zero direct emissions. The manufacturing difference becomes irrelevant within the first 1 to 3 years of operation.
The
you choose also affects long-term output, regardless of panel type.
Yes, the type of solar installation changes both the scale of your CO2 offset and the speed of carbon payback, mainly due to system size and land use.
A quick comparison across the three common project types:
Installation Type | Typical Size | Annual CO2 Offset (approx.) | Carbon Payback Period |
Rooftop residential | 3 kW to 10 kW | 2.8 to 14.4 tonnes | 1 to 2 years |
Commercial/industrial rooftop | 50 kW to 500 kW | 45 to 720 tonnes | 1 to 2 years |
Ground mount | 1 MW and above | 900+ tonnes | 1 to 3 years |
What drives the difference:
Rooftop residential
systems offset less in absolute terms but make full use of unused roof space at near-zero land cost.
Commercial and industrial rooftop
systems scale up quickly because factories and warehouses already have large, flat roof areas and high daytime energy demand. See our detailed
rooftop vs ground-mounted solar comparison for industrial sites
.
offset the most in absolute terms, since land availability allows for MW-scale capacity, like
's 80 MW project at Mota Madavada in Bagasra.
Learn more in our ground-mounted solar plant guide and ground-mounted solar plant cost breakdown.
Solar panels last 25 to 30 years, and most of their materials can be recovered and recycled at the end of that period. This is a fair question to ask before you commit to a 25-year asset.
Here is what decommissioning actually involves:
Aluminium frames
: Fully recyclable, with high recovery value. This is one of the easiest parts of a panel to reclaim.
Glass
: The front sheet, which makes up most of a panel's weight, is also recyclable through standard glass recycling streams.
Silicon cells and wiring
: Recoverable through specialized recycling processes, though this segment of the industry is still maturing globally and in India.
Degradation, not sudden failure
: Panels do not stop working after 25 years. They simply produce slightly less power each year (typically 0.5% to 0.8% annually), so many systems keep generating usable electricity well beyond their warranty period.
India is building out formal e-waste and solar panel recycling rules as installed capacity grows. Choosing an EPC partner who plans for system longevity and proper end-of-life handling matters more as your installation gets larger.
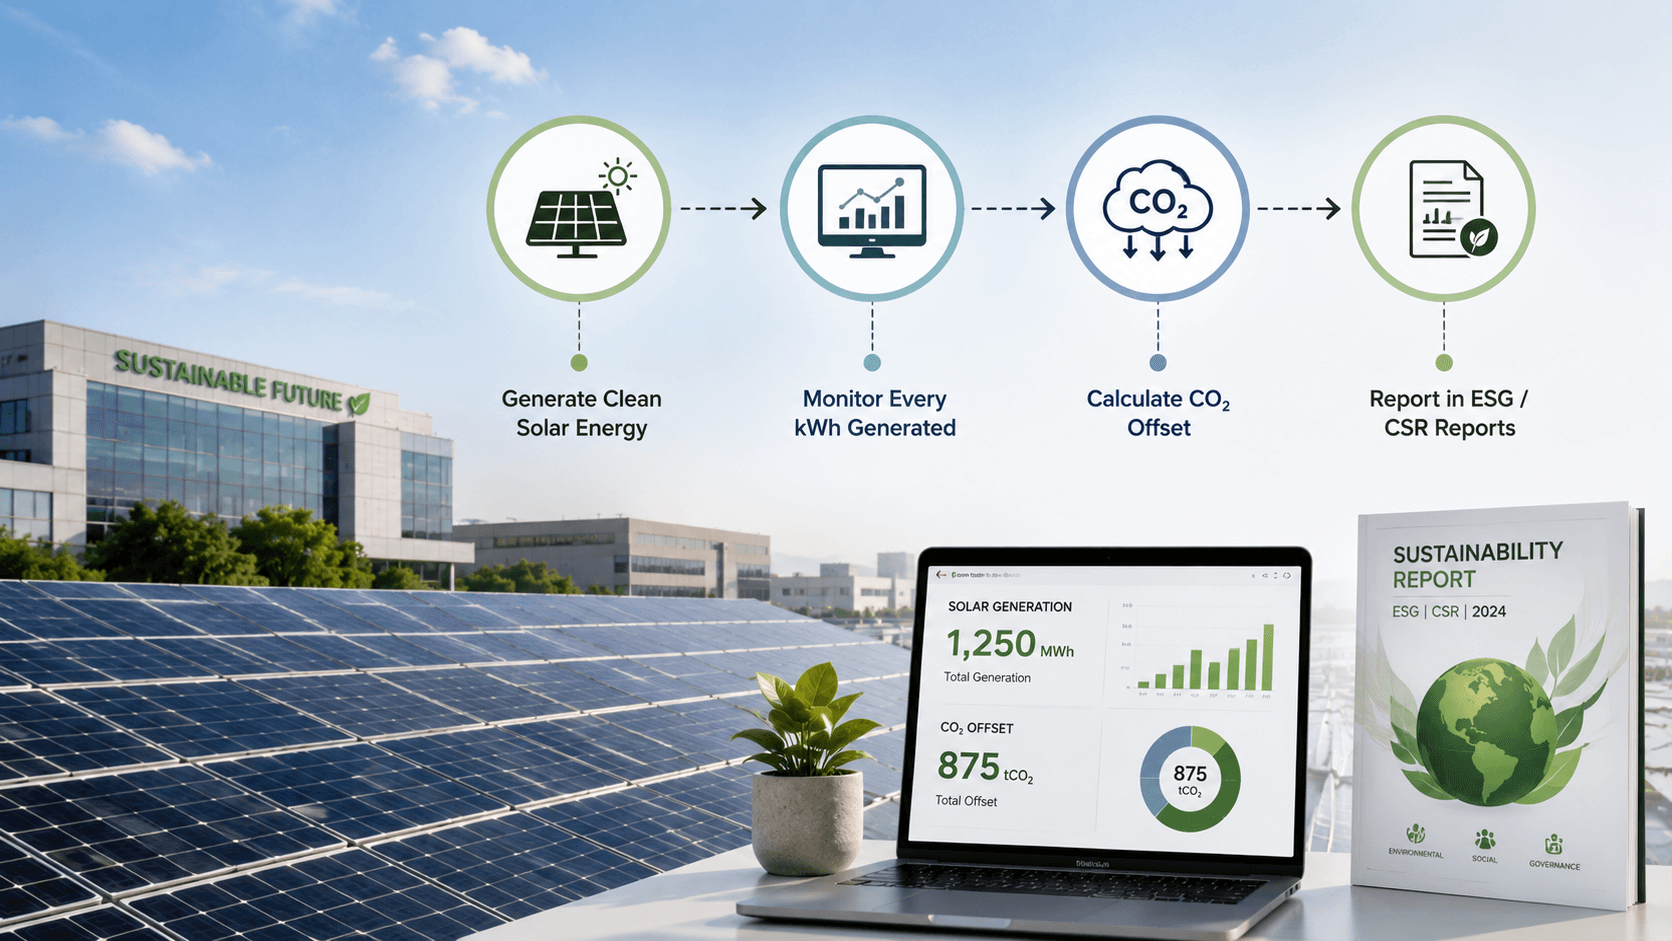
Solar installations provide measurable, auditable carbon offset data that companies can use directly in sustainability reporting. If your company tracks Scope 2 emissions (indirect emissions from purchased electricity), switching to solar is one of the most straightforward ways to bring that number down.
Here is how it works in practice:
Your solar system's generation data (available through inverter monitoring apps) records every kWh produced.
Multiply that generation by the grid emission factor (published annually by India's Central Electricity Authority) to calculate your CO2 offset.
Report this reduction in your annual ESG, CSR, or sustainability report. See our dedicated guide on
solar for IT parks and Scope 2 emissions
.
For businesses in sectors like textiles, manufacturing, IT parks, hospitals, and retail chains, this is increasingly relevant. Clients, investors, and regulators are paying closer attention to environmental performance. A solar installation gives you a tangible, verifiable asset to report on.
Your actual carbon footprint and offset depend on four factors specific to your property, not generic averages. Knowing these helps you ask the right questions before you sign a contract.
Panel type and brand
: Monocrystalline, polycrystalline, and thin-film panels carry different embodied carbon and efficiency levels.
System size and roof or land area
: A larger system offsets more CO2 in absolute terms, but only if your site has the space and sun exposure to support it.
Your location's solar irradiance
: Gujarat and Madhya Pradesh both receive strong, consistent sunlight, which improves both your generation and your carbon payback speed compared to lower-irradiance regions.
Net metering and subsidy support
: Your effective generation and savings also depend on local policy. Check our guides on
net metering and solar income in Gujarat
and the
solar subsidy in Gujarat for 2026
.
The verdict is straightforward: the manufacturing footprint of a solar panel is real but small, temporary, and quickly outweighed by decades of clean generation. You do not need to wait for a "perfect" zero-carbon panel to make a meaningful difference.
To summarize the full picture:
A solar panel's carbon debt is paid back in 1 to 3 years in Indian conditions.
The remaining 22 to 24 years of operation are a net environmental gain.
A typical home or business system offsets tens to hundreds of tonnes of CO2 over its lifetime, depending on size.
The biggest carbon lever you control is choosing a well-designed system with a reliable EPC partner, since panel sourcing and installation quality affect both performance and lifespan.
If you are building a case for solar, whether for your own household, a stakeholder, or an ESG report, the carbon math supports moving forward.
Earthwave Solar is an EPC company that handles solar projects from start to finish, from consultation to final handover.
What Earthwave manages for every project:
Initial consultation and energy needs assessment
Site visit and feasibility check
System design and quotation
Documentation and subsidy paperwork
Installation
Final handover and monitoring setup
Project Type | Examples |
Residential rooftop | River Penta Sky (30 kW), Shivdhara Skylight (80 kW) |
Industrial | True Colors, Palsana (2 MW), Pari Textile, Diamond Nagar (170 kW) |
Ground mount | Mota Madavada, Bagasra (80 MW), Goldi, Amod (2 MW) |
Wave Inverters (manufactured in-house):
Feature | Detail |
Capacity range | 2.5 kW to 125 kW |
Efficiency | Up to 97% |
Monitoring | Smart, app-based |
Gujarat (Surat office)
Madhya Pradesh (Bhopal office)
Homeowners exploring rooftop solar
Business owners and factory operators
Facility managers evaluating commercial or industrial systems
Explore our services:
Earthwave Solar can help you understand your energy needs, estimate your CO2 reduction potential, and design a system that fits your property and budget.
Get in touch:
Website:
Surat office: +91 90336 07212
A 1 kW solar system in India generates roughly 1,300 to 1,600 kWh per year. Based on India's grid emission factor, this offsets approximately 0.9 to 1.4 tonnes of CO2 annually.
In high-irradiance regions like Gujarat and Madhya Pradesh, a solar panel typically pays back its manufacturing carbon footprint within 1 to 2 years. After that, all energy produced is a net environmental gain.
No. Solar panels produce zero direct emissions during operation. All lifecycle emissions come from manufacturing, transport, and installation, which are recovered within the first few years.
Yes. You can calculate your Scope 2 emissions reduction using your solar system's generation data and the national grid emission factor published by the Central Electricity Authority of India.
Earthwave Solar provides real-time monitoring through smart inverter dashboards that track your system's energy generation. You can use this data to calculate and report your carbon offset for sustainability reporting.
FAQS
Can't find the answer you're looking for? Our team is here to help.
SUBSCRIBE NEWSLETTER
Switching to solar is easier than you think. Let us guide you to cleaner, more affordable energy.
